Agronometrics in Charts: Chilean kiwifruit production delays inflate prices


In this installment of the ‘Agronometrics In Charts’ series, Cristian Crespo F. illustrates how the U.S. market is evolving. Each week the series looks at a different horticultural commodity, focusing on a specific origin or topic visualizing the market factors that are driving change.

This week we will take a look at prices and volumes of kiwifruit in the U.S. market.
In a recent article, we discussed how Chilean kiwifruit production had decreased due to labor shortages as a result of the pandemic, and how Northern California, whose season has already ended, also saw a drop in production. Add this to the increase in consumption of fruits rich in vitamin C, and you get high kiwifruit prices in the market.
To the above, we must add the fact that kiwifruit stocks in the Northern Hemisphere (United States, Italy, Greece, France) are lower compared to previous years, and that there are also delays in Chilean production. Let us also remember that the majority of kiwifruit volumes from New Zealand go to the Asian market and to Europe.
As we mentioned, and as can be seen in the graph below, the reported average prices of kiwifruit in the North American market have been the highest in recent years. The average reported price in May was US$25.68 for containers of nine kilograms or 19.8 pounds, which represents a 15 percent increase year-on-year.
Average prices of kiwifruit (USD/KG) by history
 (Source: USDA Market News via Agronometrics) [Agronometrics users can view this chart with live updates here]
This price increase could be due to:
- Increased demand due to the trend to consume fruits rich in vitamin C amid the pandemic.
- Low stocks in the Northern Hemisphere.
- Low volumes from Chile and California.
- Delays in the Chilean season.
In the graph below we can see the decrease in Chilean kiwifruit volumes in the North American market, and although there was a recovery in May compared to April, these volumes have been the lowest in recent years.
Chilean kiwifruit volumes (KG) in the U.S.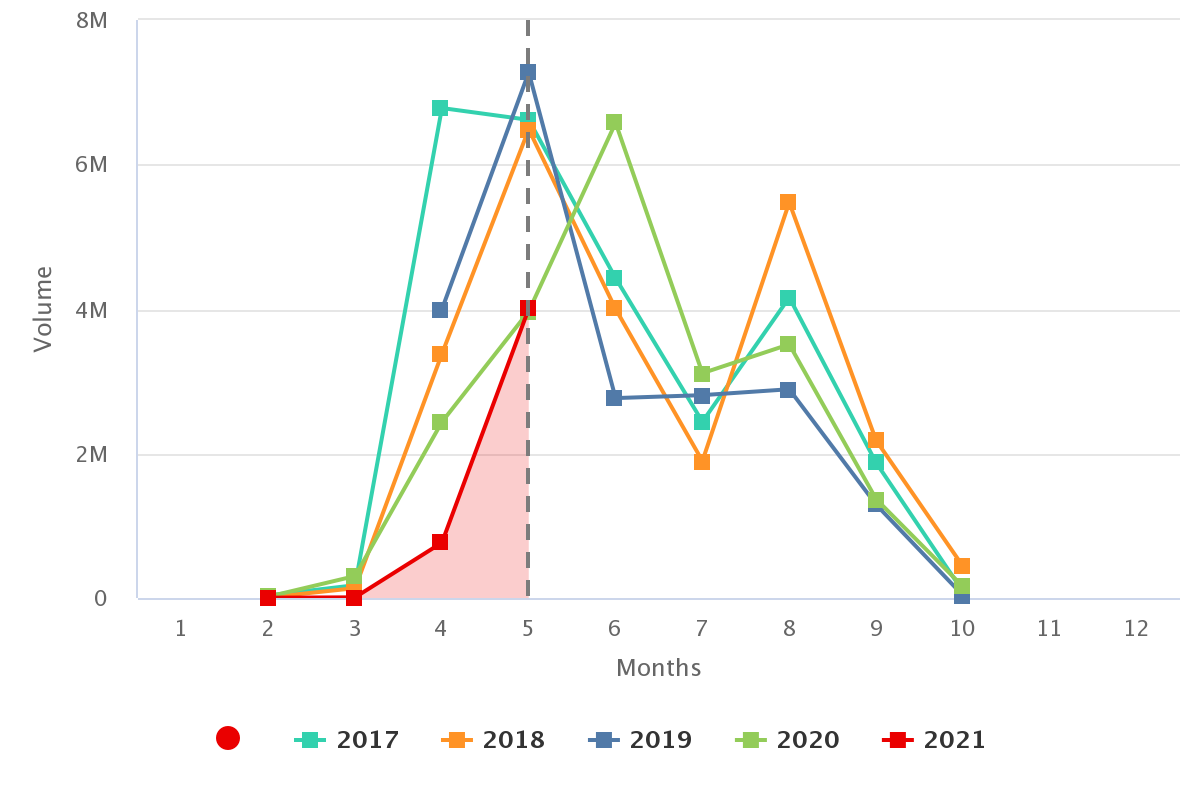
(Source: USDA Market News via Agronometrics) [Agronometrics users can view this chart with live updates here]
We will continue monitoring what is happening with kiwifruit in the United States market. We'll monitor the progress of the Chilean season, what happens with the stocks and also how demand for kiwifruit in the North American market unfolds.
In our ‘In Charts’ series, we work to tell some of the stories that are moving the industry. Feel free to take a look at the other articles by clicking here.
You can keep track of the markets daily through Agronometrics, a data visualization tool built to help the industry make sense of the huge amounts of data that professionals need to access to make informed decisions. If you found the information and the charts from this article useful, feel free to visit us at www.agronometrics.com where you can easily access these same graphs, or explore the other 20 fruits we currently track.


Subscribe to our newsletter