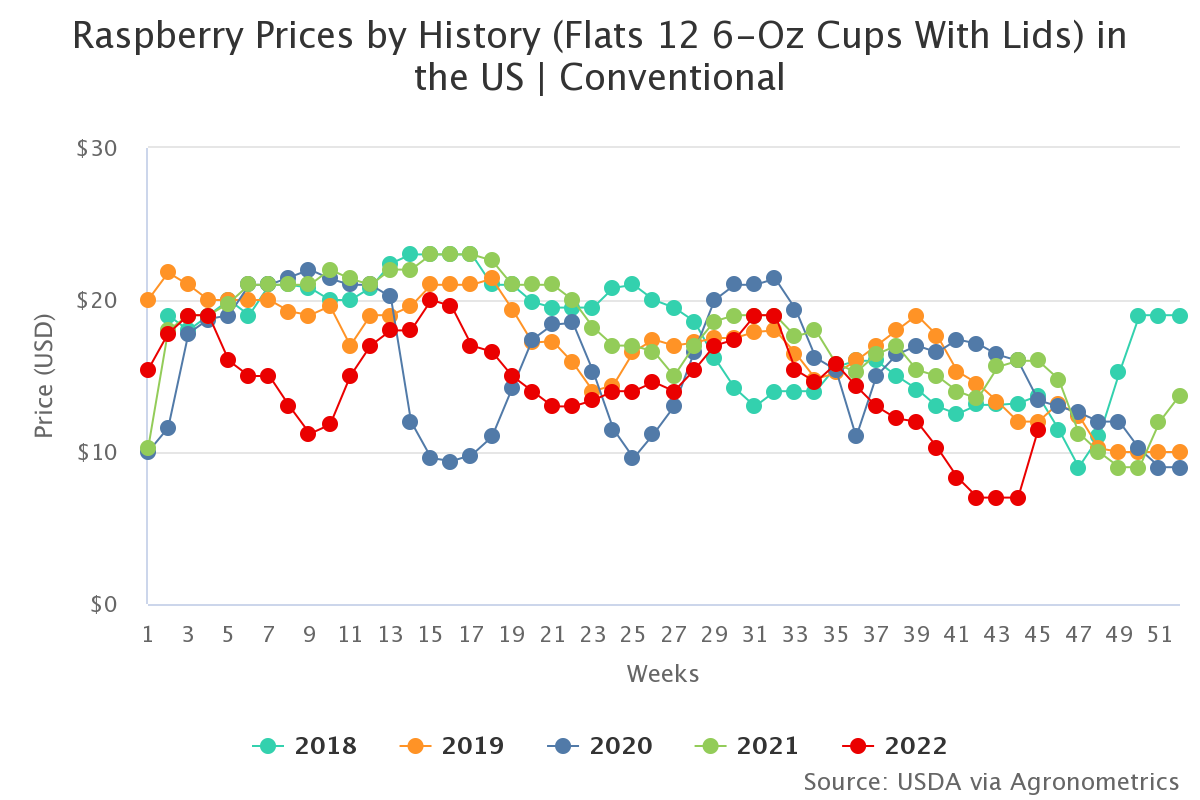
Agronometrics in Charts: Price alerts for raspberries in the US marking the beginning of week 45

In this installment of the ‘Agronometrics In Charts’ series, Valeria Concha studies the state of the US Raspberry market. Each week the series looks at a different horticultural commodity, focusing on a specific origin or topic visualizing the market factors that are driving change.
According to the USDA market news, the market for Raspberries is strong right now. Ben Escoe of Twin River Berries said that it's seeing a little bit of a change with greater demand and a lift on pricing, that he expects to continue over the next month or so, by promotions for Thanksgiving. As recorded in our "Price Alerts" on Monday 7th November, the average daily prices of conventional Raspberries in the US market have risen by 57.14% marking a $4.00 increase on the last report, from $7.00 to $11.00 per package.
Demand is strengthening too right now. “Generally it is for the Thanksgiving holiday. But at this time of year there are usually lower supplies and pretty good demand,” adds Escoe. Even with demand strengthening, it’s not expected that pricing will come back to last year’s levels. “Especially because we’re going in from an oversupply into a holiday. It’s going to be a lot of ads. But the holidays will help strengthen the market and create that movement that the raspberry market needs,” Escoe says. In addition, the supply of Peruvian blueberries is expected to start decreasing, as some producers are finishing the season.
However, increased production in Mexico, which overlaps with local production in the United States, coupled with a large supply of Peruvian blueberries this season, has hurt raspberry prices, pushing prices well below those seen in 2021. This turn in pricing is welcome given pricing right now is about 50 percent of what it was this time last year, according to Ben Escoe.
 Source: USDA Market News via Agronometrics. (Agronometrics users can view this chart with live updates here)
According to Calgiant, Mexican production is increasing with peak production projected to start in week 50, while Watsonville production is decreasing. Currently, the supply of raspberries is mostly of Mexican origin.
 Source: USDA Market News via Agronometrics. (Agronometrics users can view this chart with live updates here)
As for the exchange rate, the Mexican peso closed on Monday 7 November at its best level against the dollar since March 2020. “The strength of the peso from a monetary approach is related to the expectation that the Bank of Mexico will also raise its interest rate by 75 basis points and from a flow approach, (it is related) to the foreign currency coming in from exports, remittances and foreign direct investment," says Gabriela Siller, director of analysis at Banco Base. The US central bank's rate hike announcement gives the possibility of slowing the pace of rate hikes starting at its next meeting in December, which has supported the Mexican peso and weakened the US dollar.
In our ‘In Charts’ series, we work to tell some of the stories that are moving the industry. Feel free to take a look at the other articles by clicking here.
All pricing for domestic US produce represents the spot market at Shipping Point (i.e. packing house/climate controlled warehouse, etc.). For imported fruit, the pricing data represents the spot market at Port of Entry.
You can keep track of the markets daily through Agronometrics, a data visualization tool built to help the industry make sense of the huge amounts of data that professionals need to access to make informed decisions. If you found the information and the charts from this article useful, feel free to visit us at www.agronometrics.com where you can easily access these same graphs, or explore the other 21 commodities we currently track.


