Blueberries in Charts: Florida's prices far lower than last year

In this installment of the ‘In Charts' series, Cristian Crespo of Agronometrics illustrates how the U.S. market is evolving. Each week the series looks at a different horticultural commodity, focusing on a specific origin or topic visualizing the market factors that are driving change.
The Covid-19 pandemic has caused huge disruptions across the world in agriculture. More specifically, many of the challenges the fruit and vegetable industry faces have to do with new shifts in how consumers get products in their houses.
As habits change and shoppers seek out new products - like described in the blueberry industry in Florida - suppliers aren't sure what demand and prices will look like in upcoming weeks.
So, things like the cost of production and logistics need to be monitored going forward since no one's quite sure what prices will look like in the pandemic.
"This is a hard time, everyone along the chain is affected, especially growers. Everyone is making their best efforts and I see a lot of empathy among folks in the industry," Cort Brazelton, co-CEO of Fall Creek Farm and Nursery, recently told FreshFruitPortal.com.
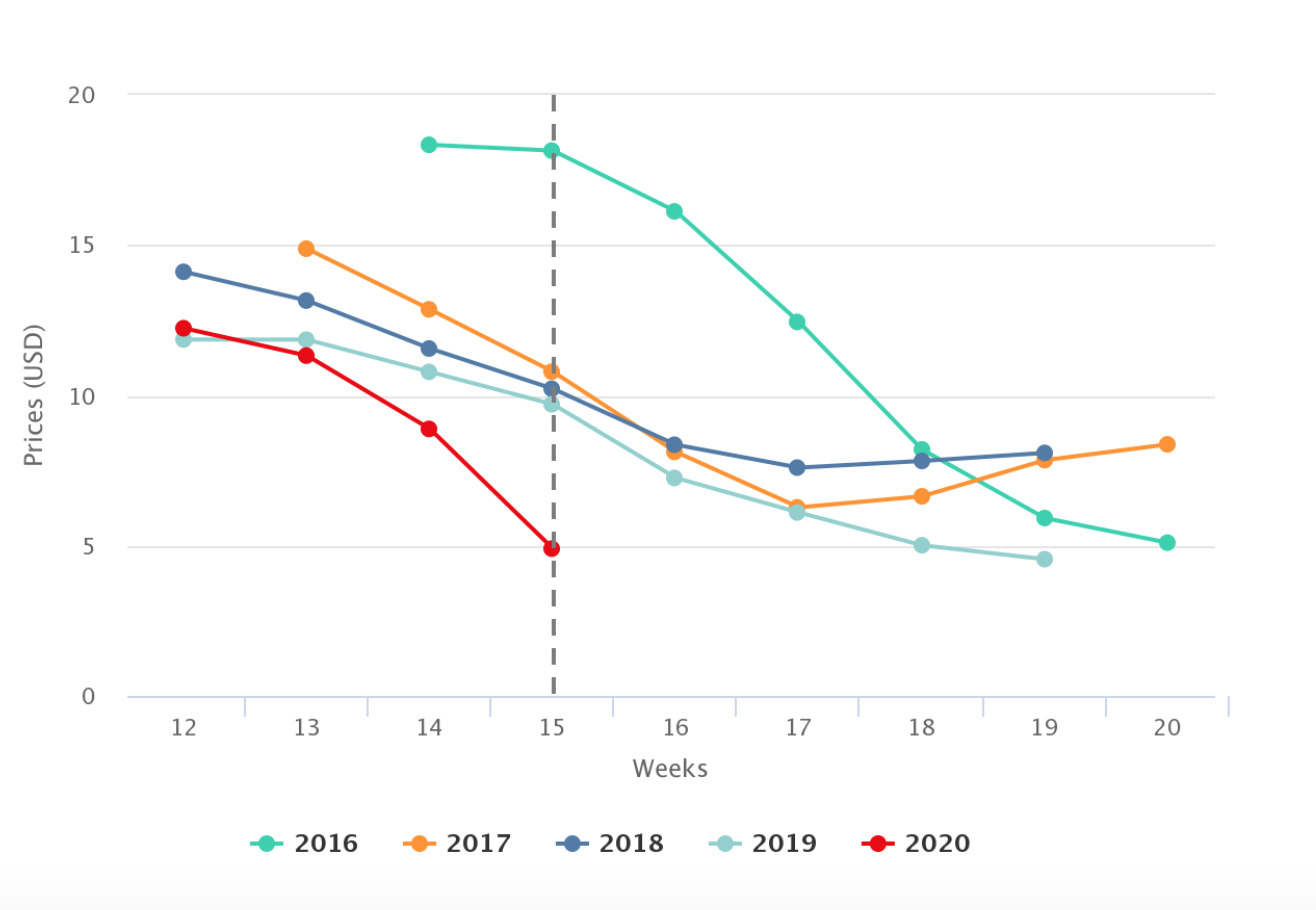
Blueberry prices in Florida are currently a bit lower than they usually are at this time of the year. In week 15, blueberry prices were around US$4.90/kg, which is 50% lower than at the same time last year.
Florida blueberry prices USD/kg in the U.S. market
(Source: USDA Market News via Agronometrics. View this chart with live updates here]
There have been concerns surrounding Florida's blueberries in recent seasons due to Mexican blueberries slowly gaining ground.
As seen in the chart below, volumes of Mexican blueberries have increased over the past five years.
Volume (kg) of Mexican blueberries in the U.S. market

(Source: USDA Market News via Agronometrics. View this chart with live updates here)
We'll have to wait to see what happens with prices in the next few weeks. Now, there are high volumes of fruit headed towards the U.S. and, because of the Covid-19 situation, consumption doesn't seem like it's up to balance out such high volumes.
In our ‘In Charts’ series, we work to tell some of the stories that are moving the industry. Feel free to take a look at the other articles by clicking here.
You can keep track of the markets daily through Agronometrics, a data visualization tool built to help the industry make sense of the huge amounts of data that professionals need to access to make informed decisions. If you found the information and the charts from this article useful, feel free to visit us at www.agronometrics.com where you can easily access these same graphs, or explore the other 20 fruits we currently track.


