Agronometrics in Charts: Weather deals a heavy blow to blackberry volumes out of Georgia and North Carolina

In this installment of the ‘Agronometrics In Charts’ series, Sarah Ilyas studies the state of the blackberry season in the US. Each week the series looks at a different horticultural commodity, focusing on a specific origin or topic visualizing the market factors that are driving change.
The blackberry industry is an integral part of North Carolina’s economy. There are approximately 1000 acres in NC where blackberries are being grown. The hot humid summers of NC provide the most optimal conditions for blackberries to grow.
In Central and Western NC, blackberries are grown in open fields, while in Eastern NC they are grown in tunnels.
Major commercial blackberry varieties for the U.S. fresh market include Apache, Chester, Natchez, Navaho, Osage, Ouachita, Prime-Ark 45, and Triple Crown, but there are many other proprietary varieties, like Ponca, an early season berry from the University of Arkansas.
Tupy is the most common variety grown in Mexico for winter export, while Marion and Columbia Star are common in the Pacific Northwest.
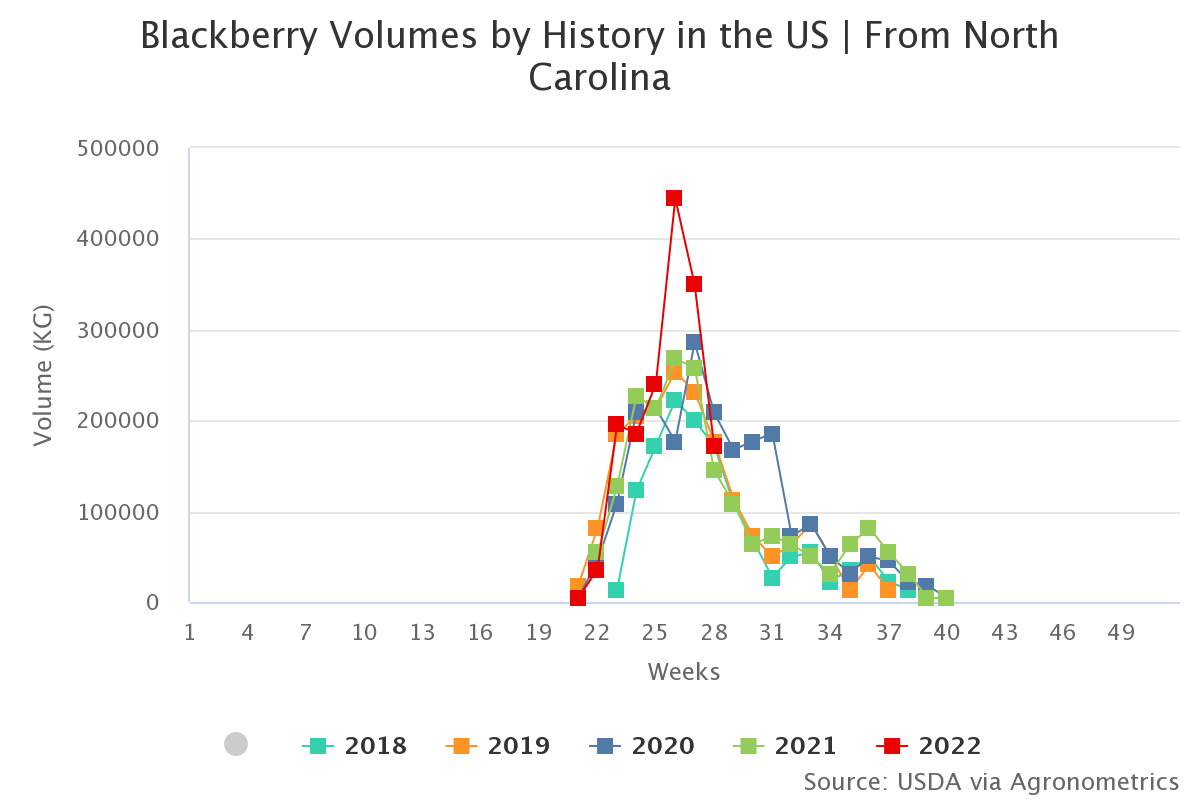
Despite the forecasts for a bountiful blackberry season, supplies out of Georgia and North Carolina have been short owing to unfavorable weather conditions.
(Source: USDA Market News via Agronometrics. Agronometrics users can view this chart with live updates here)
(Source: USDA Market News via Agronometrics. Agronometrics users can view this chart with live updates here)
Pricing this season is similar to last season. In Week 29, blackberries from North Carolina were priced at $14.6 per package while week 28 saw blackberries from Georgia being priced at $13 per package.
(Source: USDA Market News via Agronometrics. Agronometrics users can view this chart with live updates here)
The 19th North Carolina Blackberry Festival was held on July 15-16 in Downtown Lenoir and was hosted by the Caldwell Chamber of Commerce. The 2-day festival brings in upwards of 25,000 people from all over the state and is one of North Carolina's premiere street festivals.
Source: USDA Market News via Agronometrics. (Agronometrics users can view this chart with live updates here)
In our ‘In Charts’ series, we work to tell some of the stories that are moving the industry. Feel free to take a look at the other articles by clicking here.
All pricing for domestic US produce represents the spot market at Shipping Point (i.e. packing house/climate controlled warehouse, etc.). For imported fruit, the pricing data represents the spot market at Port of Entry.
You can keep track of the markets daily through Agronometrics, a data visualization tool built to help the industry make sense of the huge amounts of data that professionals need to access to make informed decisions.
If you found the information and the charts from this article useful, feel free to visit us at www.agronometrics.com where you can easily access these same graphs, or explore the other 21 commodities we currently track.


