Agronometrics in Charts: Climate change taking a toll on avocado production in Chile

In this installment of the ‘Agronometrics In Charts’ series, Sarah Ilyas studies the state of the Chilean avocado industry. Each week the series looks at a different horticultural commodity, focusing on a specific origin or topic visualizing the market factors that are driving change.
The Chilean avocado industry is closing its latest season with 155,000 tons, according to the latest estimate by the country's Avocado Committee. That figure represents a 30% year-on-year decrease from last season’s 220,000 tons.
"With our estimate of 155,000 tons produced, we believe that approximately 86,000 will be exported, so we will continue with the proportion of 45% to the domestic market and 55% for export," says Francisco Contardo, the Committee's Executive Director. The peak incoming volume recorded this season was 439,992 kgs in week 46 of 2022, a 48% decline compared to the peak volume of 852,768 recorded in week 43 of 2021.
 Source: USDA Market News via Agronometrics.
(Agronometrics users can view this chart with live updates here)
Contardo enumerated the factors that caused the year-on-year decline in volumes. According to Contardo,the main culprit was weather, with September frosts impacting many farmers. "While producers do prepare for the frost season, last year we had a phenomenon where these events could not be foreseen, thus generating losses and consequently a drop in production for this season," he explains.
Additionally, climate change and prolonged drought in Chile have compelled many producers to move further south, however, since other fruits are grown in southern Chile, there is less room for avocado cultivation there. Large patches of land have been engulfed by urbanization.
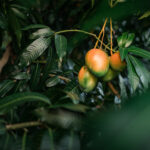
This decrease in plantation areas, exacerbated by extreme weather events such as frost, has limited the expansion of production. Hass is the predominant avocado variety grown in Chile, since it has adapted well to the country's agricultural region and continues to provide consistently high quality and yields.
However, one of the primary concerns with Hass is its susceptibility to cold and excessive irrigation, which restricts its planting area. Owing to such adverse factors, the industry does not expect any growth in production in the short term. Contardo anticipates that crop volumes will remain at the present level, with minor fluctuations observed from year to year.
Climate change has also altered the fruit's seasonality, causing overlap between the harvests of Peru and Chile. The fact that Chile and Peru share the same major export markets, namely the European Union, the United States, and China, compounds the problem.
 Source: USDA Market News via Agronometrics.
(Agronometrics users can view this chart with live updates here)
In the past, the sustainability of the avocado agribusiness in Chile was often under scrutiny owing to myths surrounding the amount of water required to grow avocados in the region . A study conducted by the Regional Water Center for Arid and Semi-Arid Zones of Latin America and the Caribbean (CAZALAC), under the sponsorship of UNESCO debunked such myths and vouched for the eco-friendliness of avocado cultivation in Chile.
The investigation revealed an annual water consumption of 8,900 m3/ha/year, which is highly efficient when compared to average values in the central zone for the cultivation of other fruits and the water consumption required in other countries for this species.
Such studies have helped the industry become more proactive towards the implementation of sustainable farming practices. Yet, such statements have occasionally had a negative impact on farmer morale and dissuaded some from pursuing avocado production.
In our ‘In Charts’ series, we work to tell some of the stories that are moving the industry. Feel free to take a look at the other articles by clicking here.
All pricing for domestic US produce represents the spot market at Shipping Point (i.e. packing house/climate controlled warehouse, etc.). For imported fruit, the pricing data represents the spot market at Port of Entry.
You can keep track of the markets daily through Agronometrics, a data visualization tool built to help the industry make sense of the huge amounts of data that professionals need to access to make informed decisions. If you found the information and the charts from this article useful, feel free to visit us at www.agronometrics.com where you can easily access these same graphs, or explore the other 21 commodities we currently track.


