


Agronometrics in Charts: U.S. organic imports rose to $5.7B in 2024

In this installment of the ‘Agronometrics In Charts’ series, we take a look at the U.S. organic imports. Each week the series looks at a different horticultural commodity, focusing on a specific origin or topic visualizing the market factors that are driving change.
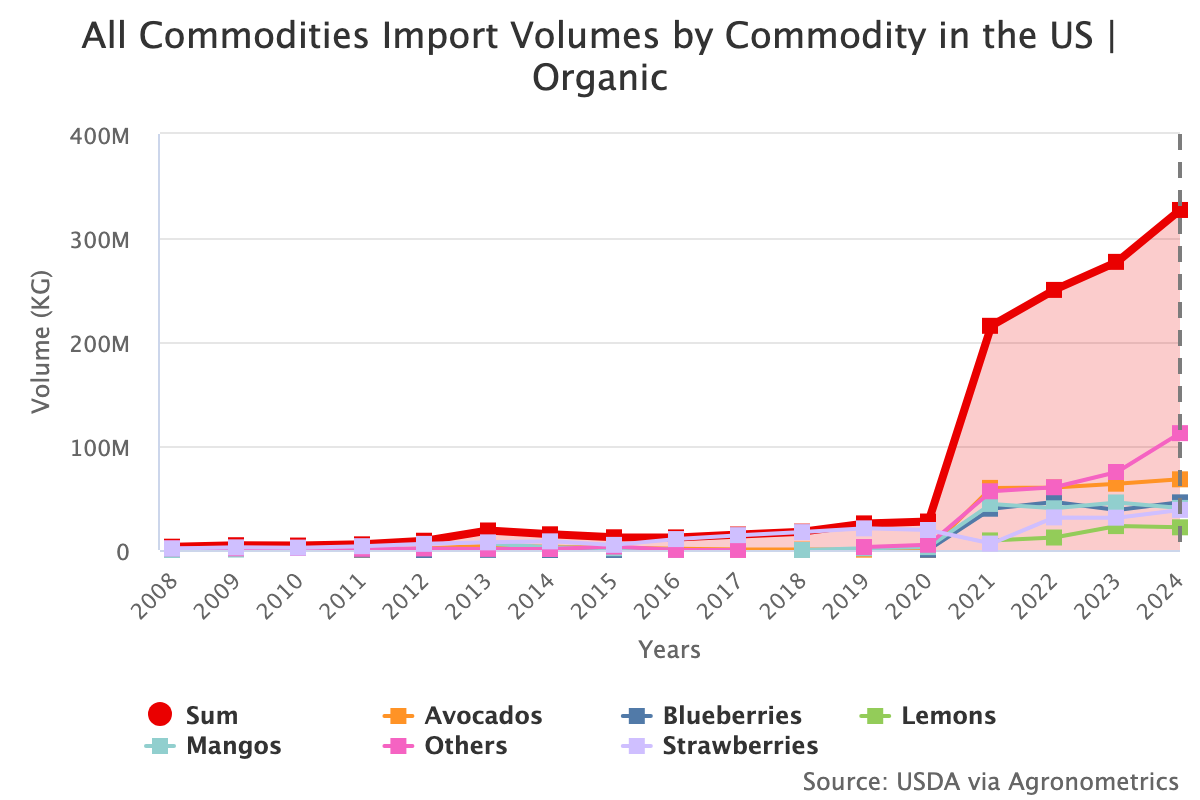
The U.S. organic market continues to show dynamic growth in consumer demand, particularly in high-value products like fresh berries. According to the USDA’s 2025 Organic Situation Report, the value of U.S. organic imports rose to $5.7 billion in 2024, highlighting the increasing appetite for organic goods—even as domestic organic acreage has declined. Over the past two decades, consumer demand for organic products has surged.
Between 2012 and 2023, the inflation-adjusted compound annual growth rate (CAGR) of organic retail sales exceeded 7%. However, while retail demand continues its upward trajectory, U.S. organic production tells a different story. The report finds that organic acreage in the U.S. has declined in recent years. The USDA’s 2021 Organic Survey showed a 10.9% decrease in certified organic acreage compared to 2019, largely due to a reduction in pasture and rangeland. Private-sector forecasts indicate this trend has continued, with a 6.8% drop in harvested organic acreage reported for the 2023/24 marketing year.
California, long the leader in organic production, has not been immune to this trend. The state saw a 4% decline in organic production acreage between 2018 and 2022, a period marked by extreme drought conditions. Despite its status as the top state in organic acreage and value, environmental stressors and systemic challenges are pushing growers to reconsider or delay organic certification.
While U.S. organic acreage is shrinking, global organic and transitioning-to-organic land has surpassed 240 million acres. Australia leads the world with 131 million acres—97% of which is used for extensive grazing. In contrast, the U.S. has fallen from third to ninth place in global rankings of organically managed land between 2016 and 2022. The U.S. organic sector stands at a crossroads: domestic production is tightening, while demand continues to grow—fueled by health-conscious consumers and premium product categories. The USDA’s renewed focus on transition programs, combined with improved tracking and international coordination, aims to close the gap.
 Source: USDA Market News via Agronometrics.
(Agronometrics users can view this chart with live updates here)
In our ‘In Charts’ series, we work to tell some of the stories that are moving the industry. Feel free to take a look at the other articles by clicking here.
All pricing for domestic US produce represents the spot market at Shipping Point (i.e. packing house/climate controlled warehouse, etc.). For imported fruit, the pricing data represents the spot market at Port of Entry. You can keep track of the markets daily through Agronometrics, a data visualization tool built to help the industry make sense of the huge amounts of data that professionals need to access to make informed decisions. If you found the information and the charts from this article useful, feel free to visit us at www.agronometrics.com where you can easily access these same graphs, or explore the other 21 commodities we currently track.


