


Agronometrics in Charts: The impact of new U.S. tariffs on blueberry exports


In this installment of the ‘Agronometrics In Charts’ series, we take a look at the impact of new U.S. tariffs on blueberry exports. Each week the series looks at a different horticultural commodity, focusing on a specific origin or topic visualizing the market factors that are driving change.


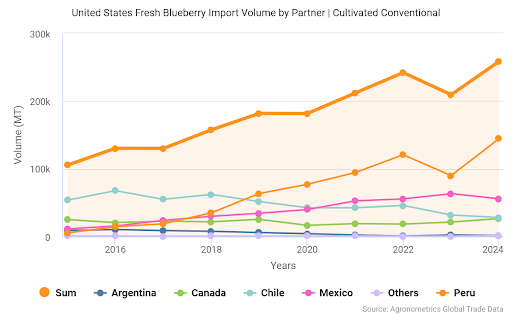
The recent decision by Donald Trump's administration to impose tariffs on blueberry imports marks a new chapter in the international trade of this fruit. Although the specific implementation details are still under discussion, the message is clear: the main exporters to the U.S. market — Peru, Mexico, Chile, and Canada — will now face a new economic barrier that threatens to stall the sustained growth the industry has experienced over the past decade.
Source: USDA Market News via Agronometrics.
(Agronometrics users can view this chart with live updates here)
A Tax That Acts Like a Drop in Demand
From an economic perspective, tariffs function as an artificial reduction in demand. For exporters, a 10% tariff is, in practical terms, equivalent to losing 10% of their value in the destination market.
If we use the average annual growth of import value to the U.S. — around 15% over the past 10 years — as a benchmark, a 10% tariff effectively rolls the industry back by about eight months. This setback might seem manageable on paper, but it becomes alarming when considering the increasing volume of fruit on the way.
The Double Blow: Less Demand, More Supply
The true complexity of this scenario lies in the combination of two opposing forces: a reduction in effective demand (due to the tariff) and a steady increase in supply, which will not stop overnight. If imports grow by 10% and effective demand falls by 10%, the resulting imbalance could translate into a price reduction of nearly 20% compared to the previous year.
For many producers and exporters, a drop of this magnitude could mean the difference between operating profitably or going into the red. Especially in an environment where logistics, labor, and financial costs are already under pressure, this situation only exacerbates the structural fragility faced by many in the sector.
Pathways to Mitigate the Impact
Unfortunately, there are no quick fixes to ensure profitability. The most immediate reaction that many export-focused economies will likely have is to devalue their currencies in order to soften the blow — a move that can improve competitiveness by increasing the returns in local currency. However, this strategy carries its own risks, including the potential for increased domestic inflation.
From the ground level, producers should focus on optimizing the value of what they export. This includes prioritizing only the highest-quality fruit and removing older or underperforming varieties that are less likely to command premium prices. Cost-efficiency will become a key differentiator.
In the medium to long term, the industry's best strategy lies in accelerating investment in demand creation. This means building consumer awareness, increasing consumption occasions, and promoting the health and versatility of blueberries. Only by expanding demand at a pace that matches or exceeds supply growth can the sector return to a sustainable growth trajectory.
Conclusion
The prospect of tariffs on blueberries bound for the U.S. is more than a temporary hurdle — it represents a structural shock that challenges the very foundation of the industry’s recent growth model. While not insurmountable, this challenge demands a coordinated, strategic response from across the supply chain. Those who act early to adapt — by managing costs, rebalancing supply, and investing in demand — will be best positioned to weather the turbulence and emerge stronger in a more competitive global landscape.
In our ‘In Charts’ series, we work to tell some of the stories that are moving the industry. Feel free to take a look at the other articles by clicking here.
All pricing for domestic US produce represents the spot market at Shipping Point (i.e. packing house/climate controlled warehouse, etc.). For imported fruit, the pricing data represents the spot market at Port of Entry. You can keep track of the markets daily through Agronometrics, a data visualization tool built to help the industry make sense of the huge amounts of data that professionals need to access to make informed decisions. If you found the information and the charts from this article useful, feel free to visit us at www.agronometrics.com where you can easily access these same graphs, or explore the other 21 commodities we currently track.


Subscribe to our newsletter


