
Agronometrics in Charts


Kiwifruit in Charts: After roller coaster prices, how will Italy enter the U.S. market?
Through the volumes, we can start to see a story form that helps explain this wild ride.
October 02 , 2018

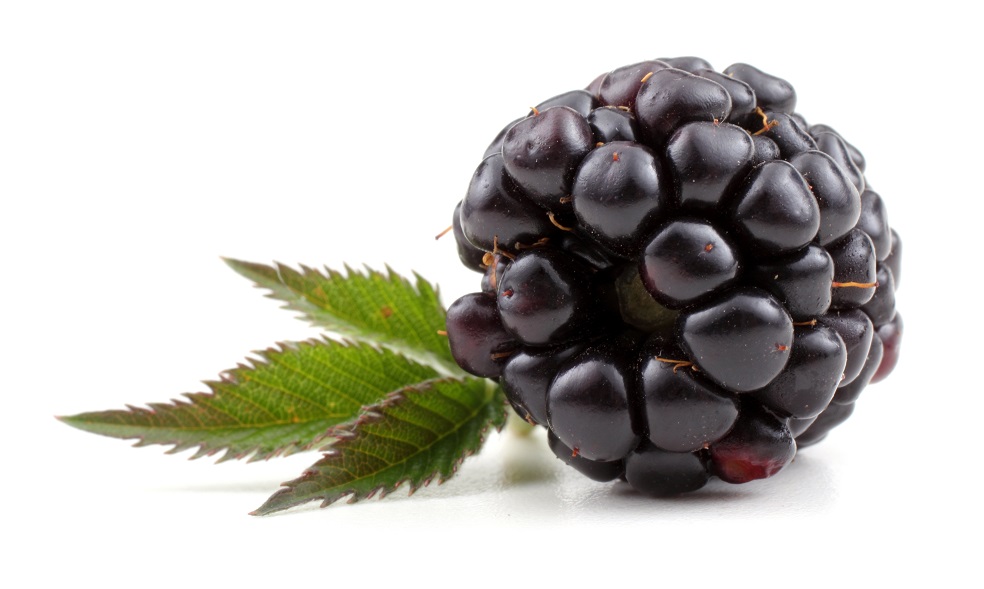
Blackberries in Charts: Will Mexico turn around its diminishing returns?
Mexico has held a consistently high share of the U.S. blackberry market over the last few years, but demand has not been keeping up with supply.
September 25 , 2018

Avocados in Charts: Chile's exports in an ever-changing dynamic market
The proportion of avocado exports that Chile sends to the U.S. has fallen over recent years on the back of increased competition from Mexico and Peru.
September 17 , 2018

Blueberries in Charts: Peru, reshaping the U.S. blueberry market
Peru has seen explosive growth over recent years in a period in which the U.S. market has traditionally been very undersupplied.
September 12 , 2018

Apples in Charts: New varieties lead U.S. prices going into Washington season
Braeburn and Red Delicious have been fetching lower prices than the market average, but Honeycrisp and Pink Lady have been enjoying large premiums.
August 28 , 2018

Lemons in Charts: Massive import growth in tandem with rising prices
This article comes as a modification to the previous Lemons in Charts, and shows that Mexico and Chile have more than doubled their exports to the U.S. over the last eight years.
August 14 , 2018


Avocados in Charts: Mexico could see high fall prices despite U.S. supply forecast
Mexico, which tripled its volumes sent to the U.S. between 2010 and 2017, has for the last two years seen price spikes from August through October.
August 07 , 2018
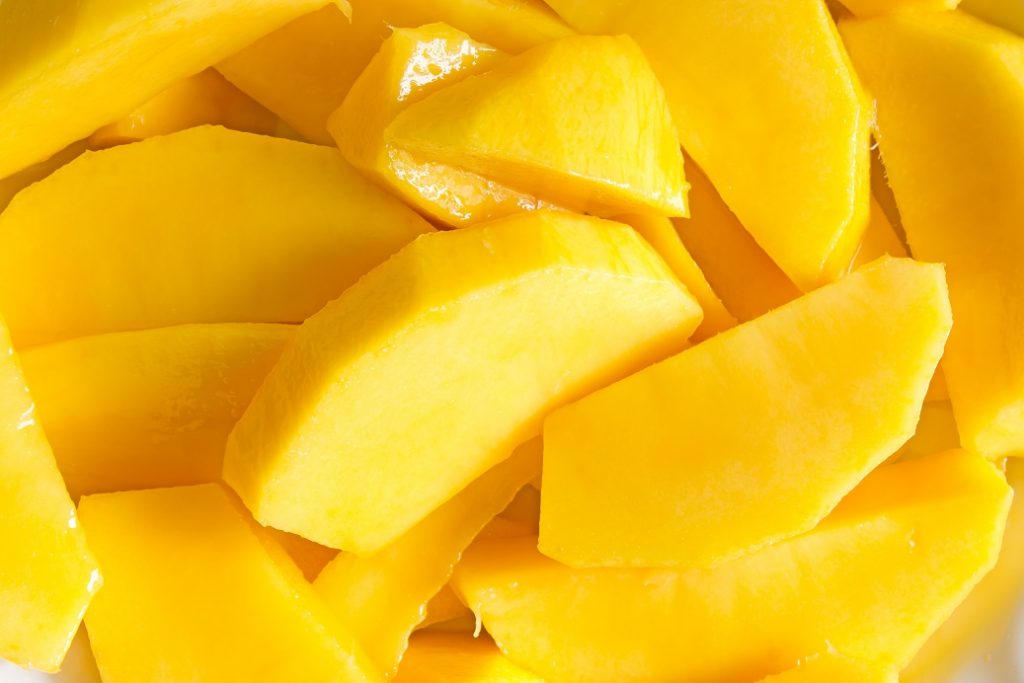
Mangoes in Charts: Record prices in June may remain high for coming months
In this week's installment, Colin Fain of Agronometrics illustrates the impressive growth being seen in the U.S. mango market and highlights some interesting price dynamics.
July 17 , 2018
Blackberries in Charts: Planesa on Guatemala's Volcanic eruption and upcoming season
June saw some of the lowest exports in years from the country, but Planesa expects them to return to normal in July.
July 10 , 2018

Blackberries in Charts: Strategic growth leads to more stable pricing
Prices typically spike around June and remain high through September, and this June prices have been higher than the last two years on the back of low volumes.
July 03 , 2018